The big Octopus Electroverse x Autotrader survey
Comparing fuel-driver fears with EV-driver realities.

For the headline snapshots, just keep scrolling.
And for the full insights? Simply download the report.

Key insights:
From range confidence to the sheer joy of driving, this deep-dive report tracks the UK’s electric evolution through the contrasts in fuel driver preconceptions and EV driver experiences. Proving that for those who have already made the switch, driving electric delivers a more satisfying, high-performance experience, defying fuel-driver expectations.


What are fuel drivers worried about?

When asked about satisfaction with their current vehicle, EV drivers are significantly more satisfied than fuel drivers.

EV driver satisfaction outperforms that of fuel drivers on every key metric.
For fuel drivers, satisfaction is trailing behind in two key areas. Reliability sees a 3-point lead for EVs, but the real divide is in running costs: a 13-point satisfaction gap exists between fuel (73%) and EV drivers (86%).
The “EV Glow” doesn’t fade. Once drivers experience the satisfaction boost from running costs and the seamless reliability of an EV, they don’t look back.

The hidden joys of driving electric
The hidden joys of driving electric are underrated elements not usually considered when measuring driver satisfaction.
While barriers to EV adoption are important to analyse, driver testimonials reveal a different narrative. The value of an EV can lie in the intangible - the “giggle” of instant torque, the comfort during longer journeys, and the unexpected advantages in regenerative braking.
Once the learning curve is navigated, the experience shifts from “managing a battery” to simply enjoying a smoother, quieter, and surprisingly fun drive.


When it comes to electric, there's a massive gap between preconceptions and reality:

When we ask EV and fuel drivers whether they agree that electric vehicles deliver on performance metrics, the divide deepens:
EV drivers are 1.7x more likely to agree that EVs deliver impressive acceleration performance (93% EV driver vs 54% fuel driver).
They are 1.7x more likely to report that EVs are smoother and more responsive to drive than fuel cars (89% vs 53%).
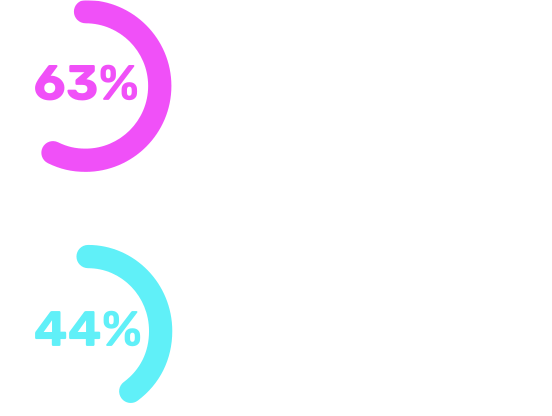
They are 1.9x more likely to say that EVs are more reliable than fuel cars (63% vs 33%).

EV drivers continue to be satisfied with their
vehicle the longer they drive
Sceptics might argue that EV owners are just excited about a new gadget. But the data shows that the longer someone owns an EV, the more likely their expectations are exceeded.
Even after 2 years of ownership, satisfaction in EV drivers remains at 85%.
And fuel driver satisfaction? Well, that dips to just 73%.


How are EVs described?
When we asked drivers for three words to describe EVs, the difference in sentiment is stark:


EV drivers said:
Convenient, Easy, Responsive, Cheaper, Relaxing.
Fuel drivers said:
Expensive, Unreliable, Difficult, Limited.
It’s a move from preconceived anxiety to what we call the 'EV Glow'.
Ongoing joy that comes from the 'intangibles', the instant torque and performance, the silence of the cabin, and even the surprise of regenerative braking.
The sentiment moves from 'managing a battery' to simply enjoying a smoother, quieter, and more relaxing drive.
The reality isn't just better than the myth, it’s fundamentally more fun.